Toward Inclusive Research: The Effect of Response Options on Gender Categorization of Faces
Elli van Berlekom, Stefan Wiens, and Marie Gustafsson Sendén
Psychology Department, Stockholm University
Author Note
Elli van Berlekom ![]() http://orcid.org/0000-0002-1949-5600
http://orcid.org/0000-0002-1949-5600
Stefan Wiens ![]() http://orcid.org/0000-0003-4531-4313
http://orcid.org/0000-0003-4531-4313
Marie Gustafsson Sendén ![]() http://orcid.org/0000-0002-8393-5316
http://orcid.org/0000-0002-8393-5316
Correspondence concerning this article should be addressed to Elli van Berlekom, Psychology Department, Stockholm University, Email: elli.vanberlekom@psychology.su.se
Abstract
Gender is not a binary category, yet much of gender categorization research continues to treat it as such in terms of response options. This study comprises two experiments that challenge the binary gender norm by exploring alternative response options to measure gender categorization. In Experiment 1 (N = 66), we compared one-dimensional and two-dimensional scales for gender categorization of a diverse set of morphed faces. We found that regardless of the response options used, participants treated gender categorically, consistently using the ends of dimensional scales. In Experiment 2 (N = 105) we compared traditional binary response options with multiple categories and free-text answers. The results suggested that while non-binary options such as “non-binary” and “I don’t know” led to categorizations beyond the binary framework in about half of the participants, free-text options did not elicit similar results. Despite the opportunity to categorize faces beyond the binary, the predominant categorizations remained as ‘woman’ or ‘man’. We conclude that while inclusive response options can facilitate acknowledgment of gender diversity, they do not fundamentally alter the binary perception of gender.
Toward Inclusive Research: The Effect of Response Options on Gender Categorization of Faces
Many transgender and nonbinary (TNB) people experience gender as flexible, fluid, diffuse, and not bounded by the typical binary of women and men (Hyde et al., 2019; Richards et al., 2016). Unlike cisgender people - who identify with their assigned gender at birth - transgender people identify with a gender different from their assigned sex at birth (Levitt & Ippolito, 2014). Moreover, many transgender people identify as nonbinary, which can be either an identity in and of itself or an umbrella term for a wide variety of gender identities other than woman or man (e.g. genderqueer, agender, genderfluid) (Monro, 2019).
In surveys and questionnaires that measure gender identity, however, gender has traditionally been constructed as a binary, where response options are limited to the categories of woman/female and man/male (Saperstein & Westbrook, 2021). Thus, these limited response options ignore TNB identities (Ansara & Hegarty, 2014). Recently, psychologists have been encouraged to include a wider range of response options beyond woman and man, such as “genderqueer” and “agender”, (Saperstein & Westbrook, 2021) or use free text options (Lindqvist et al., 2020). As awareness of gender diversity is increasing, it is increasingly common to see studies including gender options beyond woman and man (see Carleton et al., 2022; Cronin et al., 2022; D’Agostino et al., 2022 for some recent examples). Research on gender categorization of others, however, is still dominated by binary response options (eg. Campanella et al., 2001; Habibi & Khurana, 2012; Jung et al., 2019).
Two Challenges to the Gender Binary
An early challenge to the norm of binary measurement of gender in psychology came from Sandra Bem in the ´70s [Bem (1974). She devised a scale that measured gender as a psychological trait, treating femininity and masculinity as two separate constructs. This scale allowed for combinations of gender which challenged previous binary conceptions. Such combinations included androgynous, which meant scoring high on both femininity and masculinity; and agender, which meant scoring low on both. Characteristically for research of its time, Bem still largely accepted the binary gender framework. In treating gender as a psychological trait rather than an identity, for example, the BSRI implicitly assumed all respondents were women or men.
A later group of challenges to the gender binary in psychology emerged in the 2010s and onward. These challenges, often drawing from feminist and queer scholarship (e.g. Butler, 1999), were explicit about the need for psychology to include trans and non-binary gender identities (Hyde et al., 2019; Morgenroth & Ryan, 2018; Richards et al., 2016). Saperstein and Westbrook (2021)] suggested that surveys measuring gender include a range of response options, such as non-binary, other, trans man, agender, and more. Lindqvist et al. (2020) suggested an open text entry where participants can fill in their gender in an open-ended format. The free text response has the advantage of being completely unconstrained, allowing participants to enter any category, including categories which may not have occurred to the researchers. Moreover, the acceptable terms sometimes shift over time, as more marginalized voices are heard. The term transsexual for example, has been widely used and seen as acceptable, but is now understood to be stigmatizing (APA manual). A free text avoids this issue.
Historically, research in psychology primarily suggested ways to measure respondents’ own gender identity. This emphasis is understandable as gender identity is a commonly reported demographic variable. But gender is frequently also measured in terms of participants’ categorizations of others. Because self-categorization and categorization of others are different processes the best measurement of self-categorization may not be the best measurement of the categorization of others.
Measuring gender categorization of others
Research on how people perceive and categorize the gender of others has used both dimensional scales as well as discrete categories. It is fairly common, for example, to use the one-dimensional approach, where participants rate the gender of others as a single dimension, from masculine to feminine. Much of this research explores evolutionary and other reasons for gender in faces, correlating one-dimensional categorization of facial gender with other traits, such as attractiveness (Little & Hancock, 2002), and distinctiveness (O’Toole et al., 1998).
Another common approach tasks people to categorize faces according to a set of response options decided by the researchers, almost invariably woman and man. Studies using this method have shown that people rapidly and automatically categorize gender (Habibi & Khurana, 2012; Jung et al., 2019). This, in turn, indicates that gender is a salient category that determines how people evaluate others on traits, such as agreeableness, dominance, etc (Stolier & Freeman, 2017).
Moreover, participants categorize faces categorically (Campanella et al., 2001). This phenomenon has been observed when participants categorize faces that have been morphed to vary from feminine to masculine. Although a 60% female morph contains only slightly more female than male features, most participants categorized this female morph as female (Campanella et al., 2001). Such categorical effects for continuous stimuli in any domain suggest that people treat that domain as consisting of separate categories (Simanova et al., 2016). The observation of a categorical effect for gender therefore suggests that people treat gender as a strict binary consisting of women and men only.
However, this research has rarely considered the risk that the structure of response options could communicate certain ideas about gender to participants. A one-dimensional scale implies that gender can vary on a continuum. It also places masculinity and femininity at the endpoints of the scales, so that a higher rating of femininity is by definition a lower rating of masculinity. This implies that someone cannot embody femininity and masculinity at the same time, indeed, that the two concepts are opposites. Binary response options consisting of woman/female and man/male only suggest that those are the only two categories that exist. On the other hand, two-dimensional scales and categories that include non-binary response options suggest the opposite, that femininity and masculinity are not mutually exclusive and that a multiplicity of genders exists. In other words, no matter which type of response options are used, ideas are being communicated to participants, potentially influencing their responses. Most recommendations suggest taking great care not to influence participants (Nichols & Maner, 2008), but the effects of gender response options are rarely considered.
Another aspect of gender categorizations of others is that complete certainty is not possible. This is because many trans and non-binary individuals are not androgynous in their gender expression (Richards et al., 2016). Therefore, if a person aims to be inclusive, abstaining from categorizing until more information is available is always the safest option when categorizing others. However, this aspect of gender categorization has received very little attention from researchers.
The purpose of Study 1 was to test the influence of one and two-dimensional response options by on categorical responses. Drawing inspiration from Bem (1974) we compare gender categorization measured using one-dimensional response options (ranging from woman to man) and two-dimensional response options. A categorical effect suggests participants treat gender as consisting of only two categories: women and men. Accordingly, a reduction in this effect would suggest participants take a more expansive view of gender. We tested two research questions; would participants respond categorically to faces (Research Question 1) and would a one-dimensional rating scale elicit stronger categorical responses than two-dimensional (Research Question 2)?
The purpose of Study 2 was to investigate categorization using non-binary gender response options. We included multiple categories beyond women and men, as suggested by for example Saperstein and Westbrook (2021) and we also included a free text as suggested by Lindqvist and colleagues (2019). Study 2 was mainly interested in how the two non-binary options compared in terms of responses other than women and men (Research Question 3). As non-binary options have been promoted by feminist and LGBTQ+ activists, their inclusion might have more generalized effects on binary categorization. Therefore, study 2 also investigated the categorization of women and men (Research Question 4).
Study 1
Method
Participants
Swedish participants (N = 66) took part in the study in the lab at the Stockholm University campus (Mage= 37.36, SDage = 14.14, Range = 18 - 73). Participants included 33 women, 35 men, and 2 participants who did not indicate gender (self-identified gender was measured using an open-ended text box, following, Lindqvist et al., 2020)). Participants were randomly allocated into one of the two response option conditions (Ncontrol = 28, Nexperimental = 38). Participants were monetarily compensated for their time (100 sek). In accordance with the Helsinki declaration, all participants were informed that participation was voluntary and gave written consent to participate in the study.
Stimuli
The experiment included Black, Asian, and White faces from the London Face Database (DeBruine & Jones, 2017)and the Chicago Face Database(Ma et al., 2015) morphed with Webmorph (DeBruine, 2018). We selected matched pairs of faces of women and men, ensuring that the women were rated similar levels of feminine as the men were rated masculine using the codebook provided by the researchers. The morphs were made in 7 steps, from completely feminine to completely masculine. We defined the facial femininity as the degree of the female face present in the morph. In other words, a 33% feminine face was slightly tilted toward the man, a 50% feminine face was an even mixture of the two faces and a 100% face consisted only of the woman’s face. Because there were 18 face pairs morphed in 7 steps, the total number of faces was 126.
Procedure
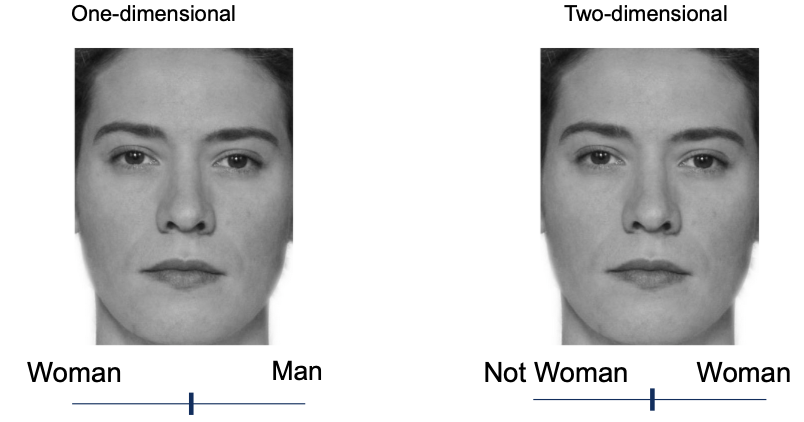
Participants completed the experiment on a computer in a quiet room. Each trial consisted of a face accompanied by the question “How would you gender categorize this person?”. In the one-dimensional control condition, participants rated gender based on a single continuum with the anchors marked woman and man. In the two-dimensional condition, participants rated each face twice on two different continua, in the “woman” continuum, the anchors were marked “not woman” and “woman”; in the “man” continuum the anchors were marked not man and man. The separate continua were presented on different trials and the order of trials was completely randomized (see Figure 2).
Data analysis
We used R (Version 4.2.2; R Core Team, 2022) and the R-packages brms (Version 2.18.0; Bürkner, 2017, 2018, 2021), papaja (Version 0.1.1; Aust & Barth, 2022), and tidyverse (Version 1.3.2; Wickham et al., 2019). We fit the data to Bayesian mixed-effects models to test the categorical effects. In all models, morph level and response options were included as fixed effects. Additionally, all models included varying intercepts for both participants and trials and varying slopes for facial gender. The pattern of scores was non-linear, meaning any linear model would probably be misspecified. Therefore, to reduce the complexity of the model, facial femininity was modeled as an ordered factor with seven levels, corresponding to each of the seven morphing steps.
Results
First, we examined the relationship between ratings of “woman” and “man” in the two-dimensional condition. These were highly correlated (R = NA). Therefore, man ratings in the multiple dimensions were reverse coded for subsequent analyses. Second, we examined whether participants responded categorically to faces (Research Question 1). Individual-level (thin lines) and group mean (thick lines) responses are visualized in Figure 3. If participants respond according to the morph level, the lines should be a straight diagonal. Instead, Figure 3 shows that most participants display a non-linear S-shape and this was also the pattern of the group means. Note that in the two-dimensional condition, participant rated each face twice. Thus there are Figure 3b has twice as many lines.
To further test this, we calculated the difference between the mean ratings when facial feminity was 33% and 67%. If participants respond linearly, this difference should be 34. Instead, in both the one-dimensional condition (M1D = 59.58, CI1D = [53.65, 65.26]) and the two-dimensional condition (M2D = 58.75, CI = [53.65, 65.26]) this difference far exceeded 34 and the narrow credible intervals suggest these measures were precisely estimated. We interpret this to mean that participants responded categorically. However, Figure 3 also suggests that there was a degree of individual variation, and some participants were more categorical than others in their ratings.
Finally, we tested whether the categorical perception was reduced in the two-dimension condition compared to the one-dimension condition (Research Question 2). The two conditions were not meaningfully different (Difference = -0.83, CI = [-5.57, 7.24], BF01= 30.47). This suggests that categorical perception was not reduced by two-dimensional response options.
Discussion
Participants responded categorically when rating faces in terms of gender. Additionally, two-dimensional response options did not reduce this effect. Indeed a highly binary view of gender was present and participants treated womanhood and manhood as opposites even though the scale would allow them to be more flexible. However, this scale only implicitly challenged the binary, as no diverse gender options were present.
Study 2
Study 2 tested a wider range of response options that explicitly challenge the gender binary. These were adapted from common ways to measure participants’ self-categorization of gender (Lindqvist et al., 2020; Saperstein & Westbrook, 2021). In Study 2 we compared three types of response options in a gender categorization task: 1) only woman and man; 2) woman, man and “other” and 3) an open text box for participants to type in their response. As a baseline, we also included control condition with only woman and man as response options.
Method
Participants
Swedish participants (N = 100) took part in the study in a lab at a Stockholm University campus (Mage= 37.16, SDage = 13.89, Range = 18 - 69). Self-identified gender was measured using an open-ended text box as recommended by (Lindqvist et al., 2020). The final sample included 56 women, 47 men 2 participants did not indicate gender. All participants were informed that participation was voluntary and gave written consent to participate in the study. Participants were randomly allocated into one of the two response option conditions (Nbinary = 32, Nmultiple = 35, N~free text~ = 33). Participants were monetarily compensated for their time (100 sek). In accordance with the Helsinki declaration, all participants were informed that participation was voluntary and gave written consent to participate in the study.
Stimuli
The stimuli were identical to those of Study 1.
Design and Procedure
todo: change order to be consistent The experiment used a between-participants design. There were three response options conditions: binary categories, free text, and multiple categories (see Figure 4). In the binary categories condition, the response options consisted of two categories: “woman” and “man”. In the free text condition, the response options consisted of an open text box. In the multiple categories condition, the response options consisted of four categories: “woman”, “man”, “other” and “I don’t know”.
Participants completed the experiment on a computer in a quiet room. Each trial consisted of a face accompanied by the question “How would you gender categorize this person?” After being allocated to one of the three conditions, participants categorized 126 faces according to the response options in their condition.
The outcome was responses to the categorization task. For analysis purposes, these were recorded in the following ways:
Other categorizations represented the trials where participants categorized faces as any other category than woman or man. This was computed by dichotomizing the variable so “other” = 1 and all other responses = 0. In the free text condition, participants responses were manually coded so variations of “other” and “non-binary” counted as other.
I don’t know responses represented trials where participants did not categorize any gender category. This was computed by dichotomizing the variables so “I don’t know” = 1 and all other responses = 0. In the free text condition, participants responses were manually coded and variations of “unsure” and “I don’t know” counted as “I don’t know”.
Results
Most faces were categorized as women or men by most participants (see Figure Figure 5). Figure 5 illustrates how many participants (x-axis) categorized how many faces (y-axis) according to the categories “other” and “don’t know” (different colors) across the two experimental conditions (separate plots). Participants did categorize faces outside of this binary in the multiple categories condition, as Figure 5 shows, and most such categorizations were made in response to androgynous faces.
That said, we were also interested in how often participants categorized faces as other than women and men when they had the option. Many more participants made categorizations beyond the binary in the multiple categories condition compared to the free text condition (see Figure 6). Figure 6 illustrates how many categorizations (y axis) beyond the binary participants made. Each bar represents how many participants (y axis) made a certain number of categorizations (x axis). The different colors denote the different categorizations. In the Free Text condition, only two participants made any other categorization than woman and man, whereas more than half did so in the Multiple Categories condition (see Figure 6 ). Participants who only categorized faces as women or men are not represented in figure Figure 6. The difference is so stark, we do not feel that inferential statistics add any more information, but the curious reader may find these in the supplemental material.
Figure 5 also seems to suggest that the non-binary categorizations in the Multiple Categories condition come at the expense of man categorization. We tested whether this was the case by examining only responses of woman or man. This meant removing a total of 226 responses from 20 participants. Overall rates of binary categorizations were similar across the three conditions (see Figure 8). Figure 8 illustrates median and interquartile range proportion of faces categorized as women (in this data set, with categorizations beyond the binary removed, any face not categorized as a woman was categorized as a man)
Additionally, we fit a Bayesian mixed-effects models to estimate the difference in proportion of woman categorization across the condition. In this model, the outcome was gender categorization (either non-binary or woman) and facial gender and response option condition were included as fixed effects. Additionally, all models included varying intercepts for both participants and trials and varying slopes for morph level. As in Study 1, facial femininity was recoded as an ordered categorical variable.
For testing, we treated the binary categories condition as the baseline against which the other two conditions were compared. The evidence indicated that the proportion of faces categorized as women was the same in the Multiple Categories and Binary Categories conditions (OR = 0.68, CI =[0.4, 1.17], BF01= 6.07). The evidence also indicated that the proportion of faces categorized as women was the same in the Free text and Binary Categories condition (OR = 1.03, CI =[0.6, 1.78], BF01= 15.58). In other words, neither the free text nor the multiple categories condition changed the pattern of categorization of women and men compared to the binary categories condition.
Discussion
In Experiment 2 we tested how free text options and multiple categories affected participants responses beyond the binary. Some participants made some categorizations beyond the binary in the multiple categories condition, but virtually none did so in the free text condition. Furthermore, categorization beyond the binary did not come at the expense of categorizations of either women or men.
General Discussion
In two experiments we tested how different response options influenced gender categorization. In Study 1 we compared two-dimensional scales with one-dimensional controls. We found that participants responded categorically and this was the case in both the control condition and the two-dimensional condition. In Study 2, we compared free text and multiple categories. We found that only multiple categories elicited beyond-binary responses. Compared to binary control, neither changed the pattern of categorizations of women and men.
The results from Study 1 are consistent with previous work on categorical perception of gender in faces (Campanella et al., 2001, 2003). Participants exhibited a categorical pattern of responses where ratings of gender were more extreme than the facial gender. This implies that participants had a conception of gender as consisting of two distinct categories. Furthermore, the two-dimensional ratings did not reduce the strength of the categorical effect. This suggests that at least in the present sample, two-dimensional response options were not enough to reduce the binary gender norms.
This differs slightly from the results of Bem (1974) who found that measuring gender as two separate scales led participants to treat gender as less binary. Moreover, where she found that masculinity and femininity were largely unrelated, we found that ratings of “woman” and “man” were strongly correlated. This is probably accounted for by the differences in outcome measures in Bem (1974) and in our study. Bem (1974) measured gender as a psychological trait in the self, whereas we measured gender as a judgment of the gender identity of others. The latter outcome is not only determined by the response options, but also by the physical features of the faces. In other words, judging the faces of others is a different task from judging ones own characteristics, and one of the primary differences is the increase in external stimuli and influences.
The finding from Study 2 that participants use non-binary response options is consistent with the work of Saperstein and Westbrook (2021) and Lindqvist et al. (2020), which has shown that including flexible response options allows participants to better express themselves. A recommendation from that literature is that open text boxes afford participants the greatest flexibility in their responses. In our study that flexibility was rarely used when the response options consisted of a free text. This likely reflects the difference between transgender and gender diverse people categorizing their own gender and cisgender participants categorizing others.
A probable explanation for the difference between free text and multiple categories in Study 2 is that the multiple categories served as a visual reminder of non-binary identity. Researchers interested in the categorization of non-binary identity should be aware that these may not spring to mind unless participants are explicitly reminded of them.
Neither free text nor multiple categories influenced the categorizations of women and men. This suggests that such inclusive response options can be suitable for investigating the categorization of women and men without skewing the results or introducing noise. This is a positive finding for researchers who are primarily interested in such categorizations but do not want to contribute to the marginalization of trans and non-binary individuals.
Overall, we recommend researchers include non-binary response options gender categorization studies. If the goal of such studies is to measure non-binary or gender diverse categorizations, we recommend Multiple dimensions, free text, and multiple categories and continua are all viable alternatives. If the primary research question is to investigate non-binary categorization, then multiple categories are most suitable. However, if the goal is to measure the categorization of women and men, free text or multiple categories may be equally suitable.
Limitations and future directions
One limitations of this study is the sample size. The Ns in each condition are below many of the conventional recommendations in social psychology. However, these recommendations are typically made based on the assumption of a single trial per participant. In contrast, each participant completed 126 trials in our experiment. This allows for precise detailing of the within-participant processes. As sucg, the present study resembles psychophysical experiments, which also features small numbers participant carrying out many trials. Power is often portrayed as a function of sample size, and this is true, the number of trials is also a factor in power. Indeed, the overall analyses included more than 8000 data points in each experiment, and the final estimates were measured with a high degree of precision. All that said, we do note that the generalizability of the experiment is somewhat reduced.
Another limitation of this study is that it does not account for the influence of markers of gender other than faces. Such markers include hair, clothes, and makeup and Transgender and gender diverse often use such markers to signal their gender to others. Moreover, the faces used here were not “realistic”, in that they did not realistically depict gender diversity as it is often displayed in the real world. In that sense, it is possible that we underestimate the rates of people responding with one of the options beyond the binary.
Conclusion
In two studies we tested how different response alternatives affected gender categorizations. In Study 1, participants responded categorically to the faces, both when rating gender using one-dimensional and a two-dimensional scales. This suggests that participants generally had a binary conception of gender which was not influenced by response options. In Study 2, participants were more likely to categorize faces beyond the binary when using multiple categories, including “non-binary” and “I don’t know” than when using a free text option. In comparison to self-identification questions where open-ended responses are seen as the most inclusive alternative (Lindqvist et al., 2020), the categorization of others benefits from response options that explicitly remind participants that not all people identify as women or men.
References
Figure 1
Example of a seven-step morphing spectrum
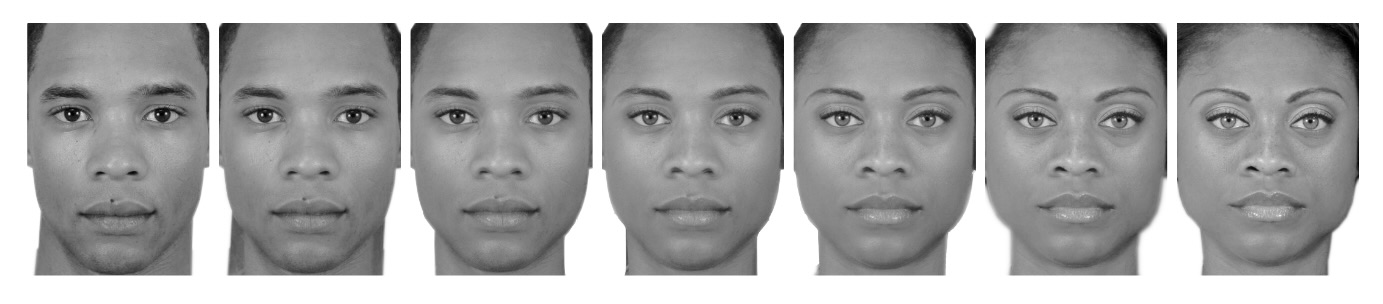
Figure 2
Sample trial from each of the three conditions
Attaching package: 'gridExtra'The following object is masked from 'package:dplyr':
combineFigure 3
Participant level and mean ratings of faces in One-dimensiona and two-dimensional conditions

Figure 4
Sample trial from each of the three conditions
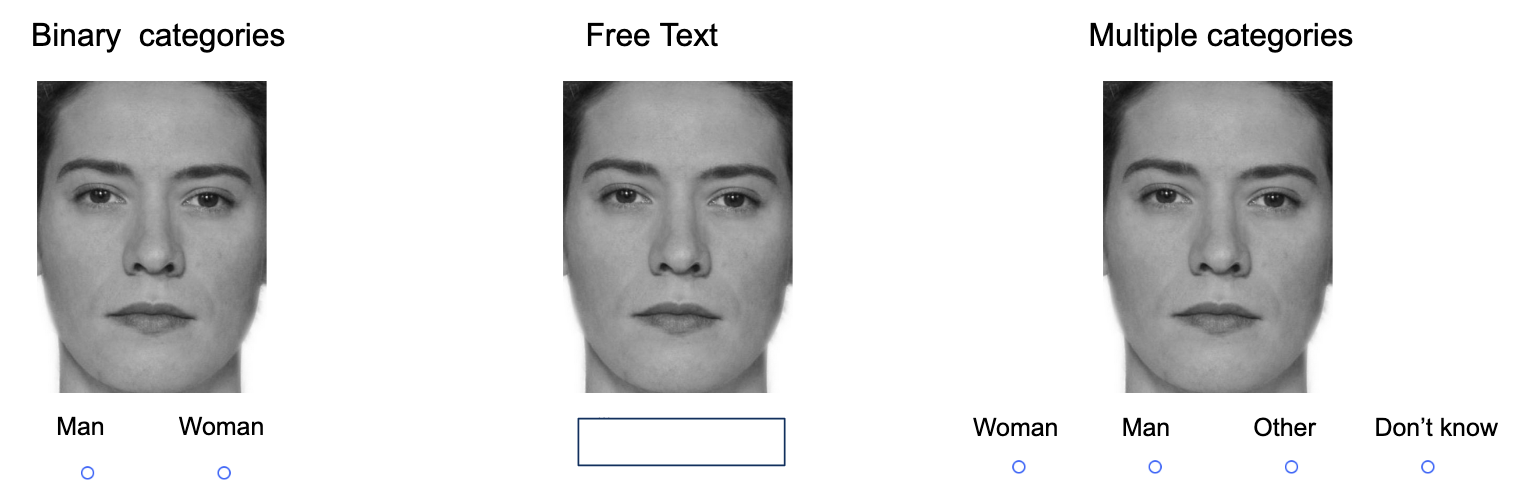
Figure 5
Gender Categorizations by Participants

Figure 6
Responses of other and I don't know across the multiple categories and free text condiitons

Figure 7
Alternative version of the previous figures

Figure 8
Participant Proportions for Categorizing Faces as Women Across Three Conditions
